Liquid Plumber: How to unclog your pipeline
- 01.04.2023
- Posted by: Tom Tischner
- Category: Innovation

Our previous posts highlighted two fundamentals of a measured sales process: Yield and Velocity, or your win rate and the speed with which opportunities move through your pipeline. It’s easy to construct a reasonably accurate forecast if you have control over the likelihood and timing of winning opportunities. But what if your pipeline is filled with a bunch of opportunities that are stuck?
Wouldn’t it be nice to figure out which opportunities are going to clog your pipeline before you even drag them through your sales process and waste a bunch of SG&A?
But no, time and again we’re called in to help customers with the predicament of inaccurate forecasts. Instead of delivering on what’s in the pipeline, companies miss their #revenue targets and sales leaders look for answers to explain what happened. At that point, it’s too late, and trust in the #forecast has eroded at best. The usual consequence is to micromanage opportunities rather than gain a systematic understanding of the Sales process, let alone capture the appropriate qualification parameters that warrant the attention of a consultative Sales resource. To make things worse, management then regresses into a download of the pipeline to Excel. The opportunities are manually scrutinized one by one, treated with a big serving of doubt and suspicion, and diluted to cut the pipeline into pieces. Executives then practice pipeline minimalism, and adjust the company’s Operating budget, usually by ‘right-sizing’ the company. Reductions in workforce and elimination of variable costs follow.
Of course, there’s nothing ‘right’ about right-sizing based on the sequence of events above: The reductionist exercise is neither right nor did it address the root of the problem: A systematic error in qualifying #opportunities .
Fortunately, there is a remedy. You don’t need to call Bill Murray to bust the ghost out of your pipeline; no need to buy a chemical that removes a clog and also ruins your septic system. Fun aside, manual efforts to remove opportunities that won’t deliver are crude tools that tend to underestimate the pipeline, and worse, remove data that should be used to understand how the clog got there in the first place.
The solution is surprisingly ordinary. Why not look at the activity level across opportunities to measure buying behavior? After all, there could be a good reason an opportunity appears stuck when you look at how long it’s taken to move from qualification to proposal. In other words, don’t just rule out an opportunity that takes a bit longer just because you’ve got your Sales cycle limit set at 90 days. Or do you? Today’s #CRMs allow you to timestamp data, log events, and know when stage transitions take place. You can even access important milestones via a convenient #API into a BI tool such as Tableau or Microsoft BI.
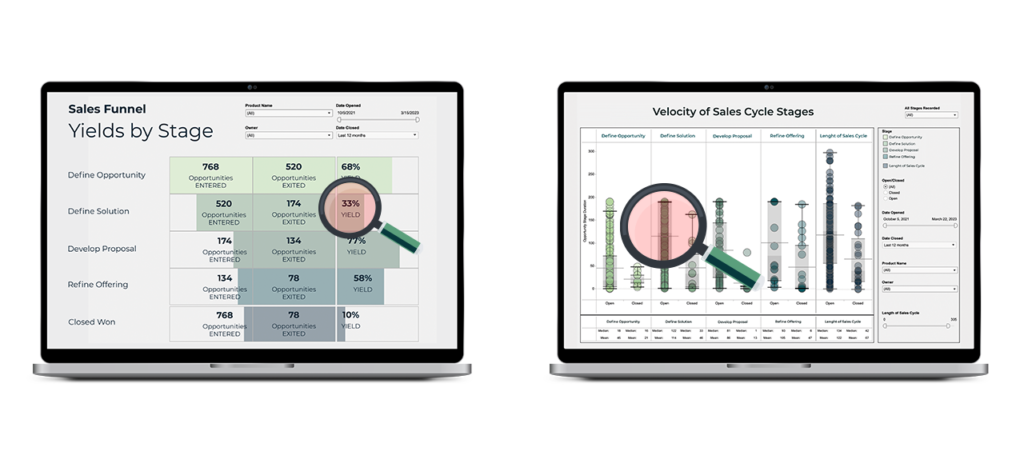
Take a look at an example of a funnel as viewed from two fundamental KPIs: Yield and Velocity, below.

Notice something? Opportunities appear stuck in the Define Solution stage, and result in lower than desired win rates in the end. The Velocity plot shows a dense population stuck in that stage. So now you have the what, but you obviously need the why. This is where a staleness report like the one below comes in handy.
A staleness report is such an easy way of distinguishing active opportunities from stuck ones. In the example above, if only 1 in 3 opportunities make it through the definition of a solution, and half of them take more than 100 days to do so. There is a good chance that the population of opportunities splits into those that race through this phase and others that are getting stuck. Take a look at two opportunities in that stage that look similar but are very different:

These two opportunities need to be treated differently. Both have spent over a quarter without stage change and are stuck in the same stage, but the GE opportunity hasn’t seen any activity, while the #honeywell opportunity logged activity within the last two weeks. Likely, there are a few distinctly different characteristics about these two. One may be an existing customer, the other may be on hold waiting for capital; one may be expanding its fleet but hung up on infrastructure, the other flush with inventory and slowing down a repeat order.
A staleness report is the first line of defense when the #pipeline is clogged. Measured activity and stage changes are closely correlated to customer intimacy, and the connection the Sales team has with the customer’s buying influences. Ultimately, staleness allows quantitative boundaries on when an opportunity is still in play, and when it’s time to remove it from the current pipeline. Removing opportunities is the healthy version of right-sizing the forecast and setting expectations based on data and facts, not based on doubt, trust, or anyone’s opinion about the relationship.
For the next measure of pipeline analytics, stay tuned, follow us on LinkedIn, and help us get quantitative analytics in the hands of Sales teams. Thanks for reading!
